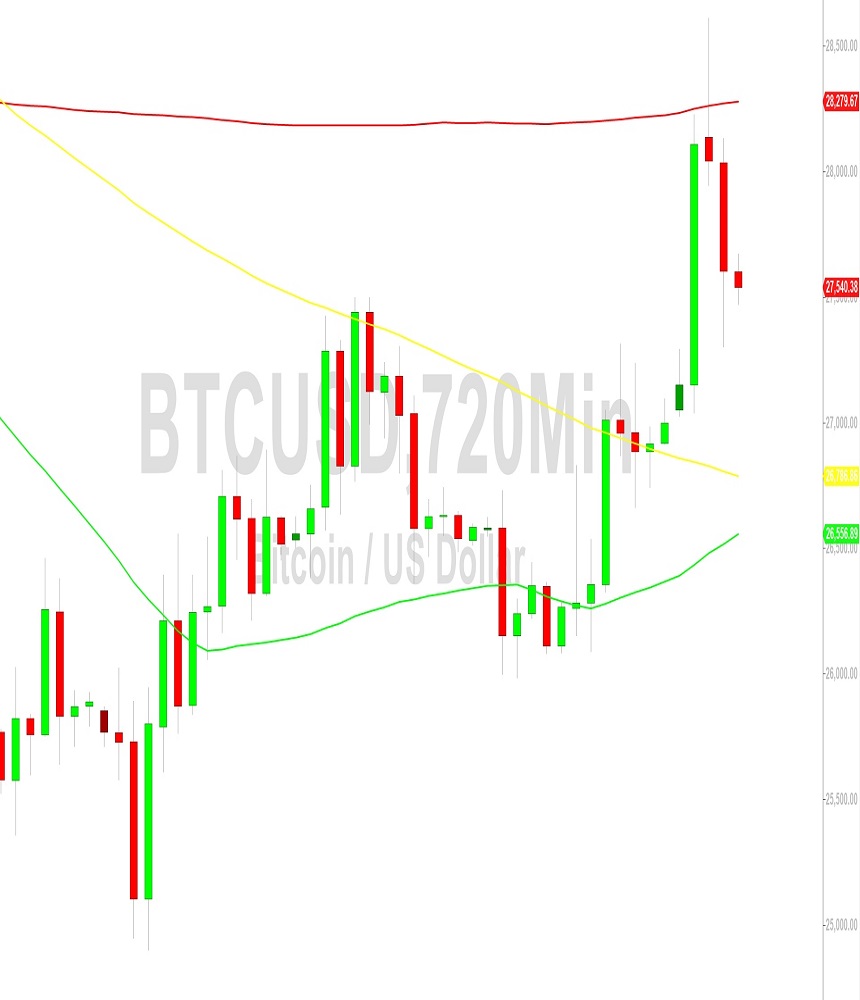
Bitcoin (BTC/USD) witnessed a resurgence in volatility during the early Asian trading session. The pair retraced its steps after hitting a peak around the 28613.37 mark, marking a nearly perfect test of a downside price target associated with selling pressure around the 30222 and 29665 levels.

Profit-Taking Pressures BTC/USD
Profit-taking drove BTC/USD lower, with the cryptocurrency slipping to the 27302.30 area following its multi-month high. Bears are now eyeing further consolidation. Stops were triggered at various levels during the recent rally, including the 27432, 27567, 27620, 27806, 27941, 28029, 28234, and 28404 marks. Additional upward price targets include the 28769, 29151, and 29964 levels. Areas of potential technical resistance and selling pressure encompass the 28614, 28769, 28934, 29228, 29665, 29964, 30053, and 30222 levels, with stops mentioned above the 30178 and 31862 areas.
Key Support Levels
In the wake of the ongoing price appreciation, areas of technical support and potential buying interest are identified at the 27241, 27124, 26944, 26699, 26577, 26522, 26274, 25749, and 25670 levels. Further below the market, stops are gathering beneath certain downside price targets, including the 24155, 23270, 23204, 23164, 22949, 22028, 21496, 21242, and 20702 areas.
Important Technical Levels
Three crucial technical levels that technicians are closely monitoring include the 29514, 23438, and 20195 levels. These levels are associated with selling pressure observed around the 69000, 59249, and 52100 marks.
Moving Averages Indicate Bullish Momentum
Technical analysis reveals that the 50-bar MA (4-hourly) is signaling bullish momentum, standing above the 100-bar MA (4-hourly) and the 200-bar MA (4-hourly). Additionally, the 50-bar MA (hourly) is indicating bullish strength as it positions itself above the 100-bar MA (hourly) and the 200-bar MA (hourly).
Current Price Levels
At present, the price is closest to the 50-bar MA (4-hourly), which stands at 26858.49, and the 100-bar MA (hourly), at 27347.17.
Technical Support and Resistance
Technical support is anticipated around the 24440.41, 23270.10, and 22769.39 levels, with stops likely positioned below these levels. On the flip side, technical resistance is expected near the 31986.16, 32989.19, and 34658.69 levels, with stops potentially placed above these levels.
Oscillator Indicators
In the 4-hourly chart, SlowK is bearishly below SlowD, while MACD is bearishly below MACDAverage. On the 60-minute chart, SlowK is bullishly above SlowD, but MACD remains bearishly below MACDAverage.
Disclaimer: The technical analysis provided by Sally Ho is for informational purposes only and is sourced from a third party. It does not necessarily reflect the views of Crypto Daily and should not be considered as legal, tax, investment, or financial advice.
- Taylor Swift Reveals Elizabeth Taylor’s Estate’s Reaction to The Life of a Showgirl Song
- Beloved Sci-Fi Classic Back to the Future Trilogy Arrives on Netflix This November
- Bridgerton’ Creator Chris Van Dusen Returns to Netflix With New Drama ‘Calabasas’
- Timothée Chalamet’s Blockbuster ‘Wonka’ Set to Arrive on Netflix This November
- Abbott Elementary Season 5 Episode 5: Release Date, Time & Where to Watch
- Do You Want to Get a PAN Card? Know How to Apply and Required Documents